System Logs in WhatsCloud
WhatsCloud offers a comprehensiveLog Viewerthat provides real-time insight into your application’s health and behavior. Whether you're debugging, tracking failed requests, or analyzing system changes, this module ensures detailed log visibility for developers and administrators.
Key Features
Severity-Based Filters
WhatsCloud categorizes logs using industry-standard logging levels. Each level represents theseverity and purposeof the log entry, allowing you to filter for the most critical issues:
| Level | Description |
|---|---|
| Emergency | System is unusable and requires immediate attention. 🛑 Example: “Server crashed and cannot restart.” |
| Alert | Action must be taken immediately to prevent system failure. 🚨 Example: “Database connection dropped unexpectedly.” |
| Critical | Critical conditions that threaten core functionality. ❗ Example: “Failed to load payment gateway keys.” |
| Error | Runtime errors that should be investigated but don’t halt the system. 🧨 Example: “Webhook timeout” or “API failed to respond.” |
| Warning | Something unexpected occurred but the system continues to function. ⚠️ Example: “Deprecated config used.” |
| Notice | Normal but significant events. ℹ️ Example: “New admin user created.” |
| Info | Informational messages for general application events. 📋 Example: “User logged in successfully.” |
| Debug | Detailed debug information for developers during testing. 🔍 Example: “Variable $user contains null.” |
| Local | Custom tag to show logs relevant only to local/development environments. 🧪 Example: “Testing mode active.” |
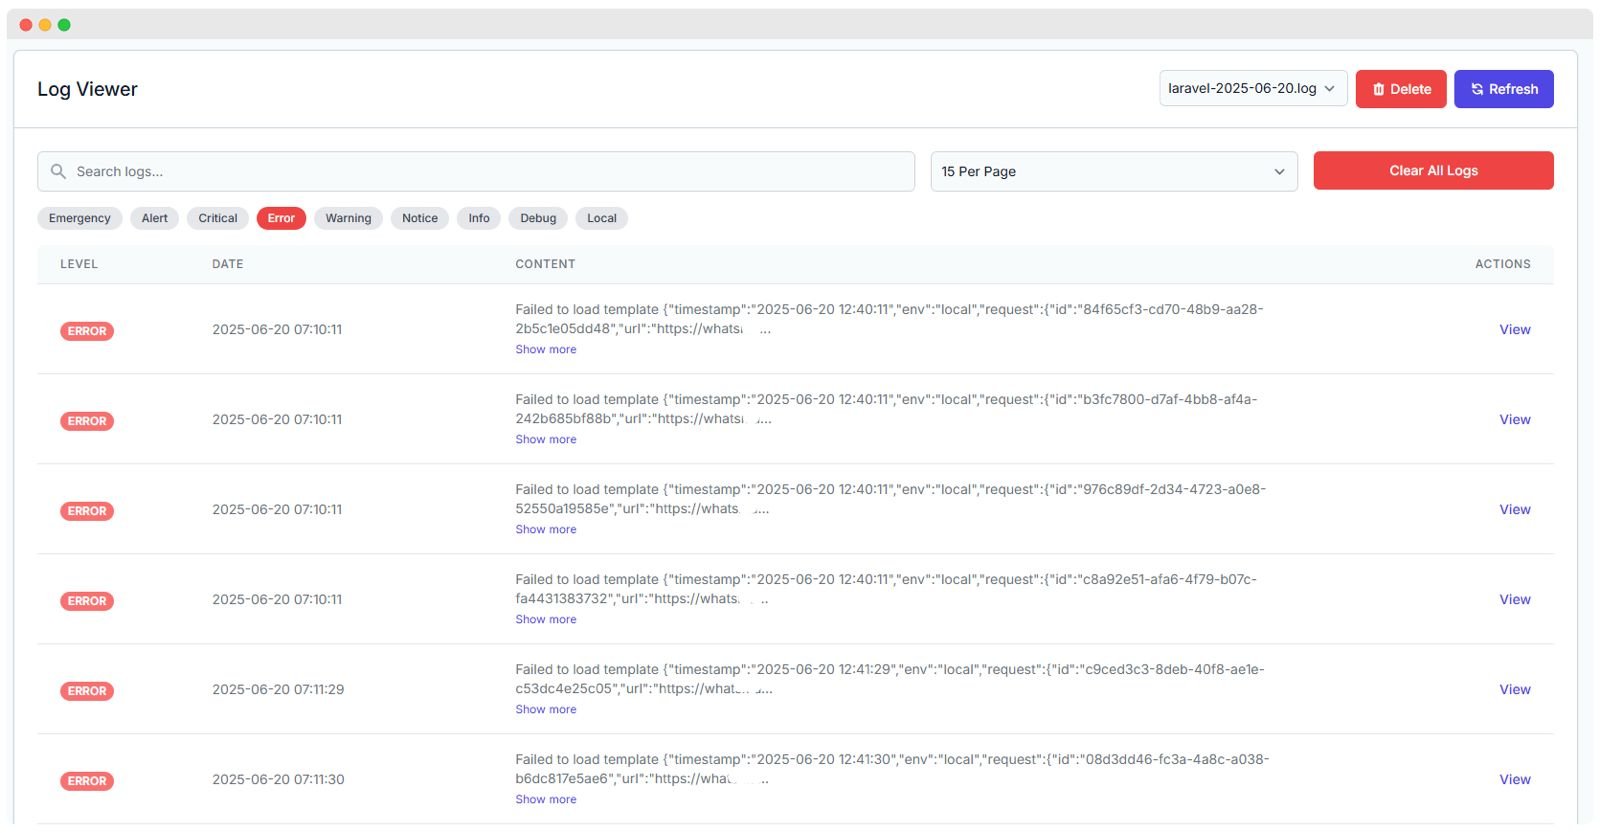
Log Entries Overview
WhatsCloud presents logs in a user-friendly, paginated table with the following key columns:
| Field | Description |
|---|---|
| Level | Severity classification (e.g., ERROR, DEBUG, INFO). |
| Date & Time | Timestamp of when the log was generated (e.g., 2025-06-20 07:10:11). |
| Content | Brief description or a truncated JSON message of the error or system message. |
| Actions | A View button to examine complete log details in a modal window. |
| Pagination | Control for selecting how many entries to display per page (e.g., 15 Per Page). |
View Log Entry Details
When clicking on theViewbutton, a modal displays detailed content from the selected log, which is essential for deep debugging.
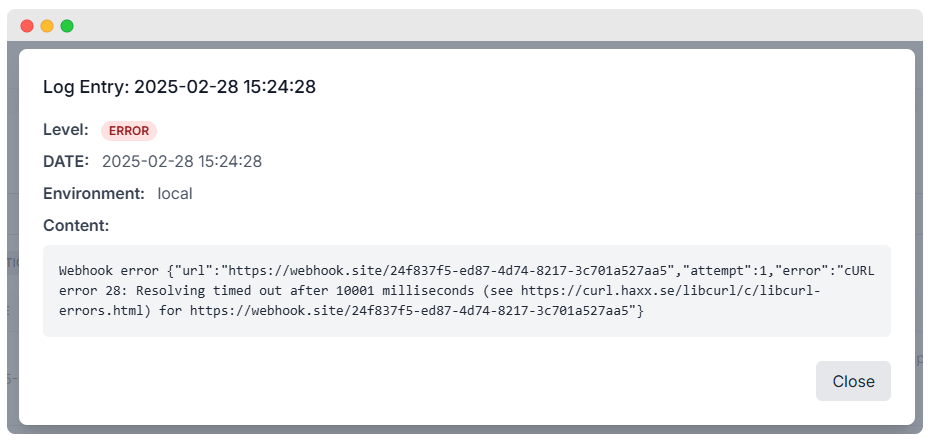
Example Log Entry:
Log Entry: 2025-02-28 15:24:28
Level: ERROR
Environment: local
The detailed view often shows the full stack trace, which is invaluable for diagnosing issues like anetwork timeoutorDNS resolution failureduring a webhook or API call.
Log File Management Options
You can manage and maintain your log files effectively using the actions provided at the top of the viewer:
- 🔄 Refresh – Updates the log table to show the latest entries.
- 🗑 Delete – Deletes the currently selected log file (use with caution).
- 🚨 Clear All Logs – Erases all log files in one action for cleanup and disk space recovery.
- 📂 Log File Selector – Allows you to switch between different log files (e.g.,
laravel-2025-06-20.log).
Common Log Issues and Descriptions
Understanding the context of common issues helps prioritize debugging efforts:
| Issue Type | Description |
|---|---|
| Webhook Timeout | Occurs when external APIs or webhooks fail to respond within the allowed time limit. |
| Template Errors | Happens when system message or email templates fail to render properly, often due to bad merge fields. |
| Config Errors | Usually due to missing environment variables or outdated configuration cache. |
| Route Not Found | Indicates missing or invalid endpoint usage, resulting in a 404 error internally. |
Log Actions Explained
The View action is the most critical tool for detailed analysis.
View
- Clicking the View button opens a Modal window showing the full, un-truncated log entry.
- This feature reveals the Full content of the log, including the exception stack trace, API response bodies, and full context data.
Why the View Action Matters
- ✅ Helps identify the root cause of recurring issues by providing the exact line of code where an exception occurred.
- ✅ Enables quick inspection without needing to open log files manually on the server.
- ✅ Works seamlessly with the severity filters for highly efficient troubleshooting.